 Bitcoin Years
Home / Bitcoin World Map
Bitcoin World Map Where Bitcoin runs
Every dot of light is a group of Bitcoin nodes that anyone can connect to. Explore where they are, what software they run, and where Bitcoin ATMs have been mapped.
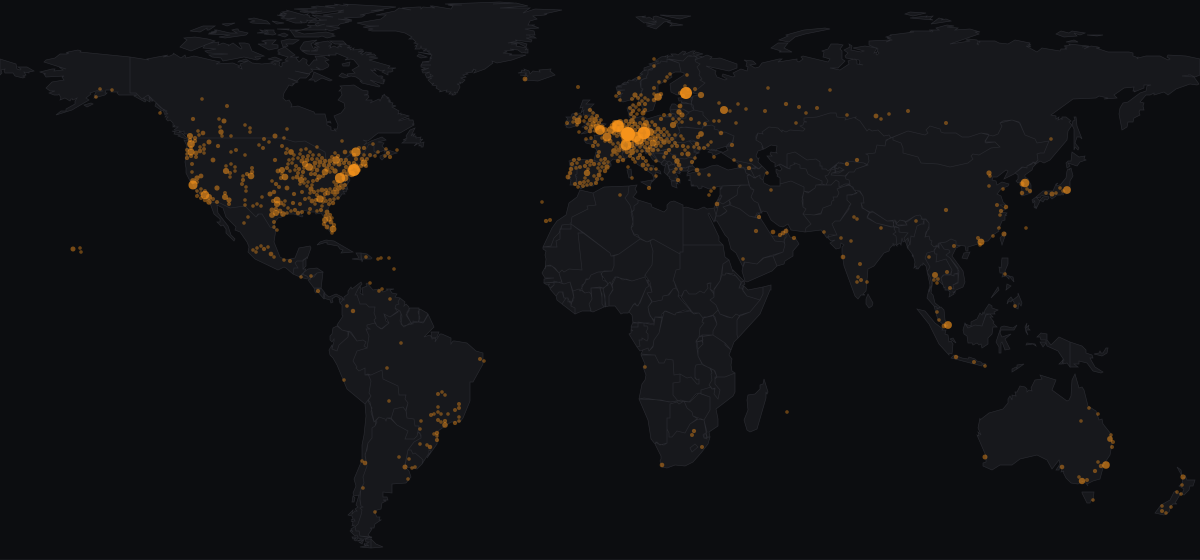
The interactive map needs WebGL, which this browser does not provide. The table below has the same figures.
Nodes: snapshot of Nov 6, 2026, 18:44 UTC · ATMs: OpenStreetMap data of Nov 6, 2026, 12:41 UTC
Reachable nodes by country
Nodes with an approximate location (IPv4 and IPv6), snapshot of Nov 6, 2026, 18:44 UTC. Share is of the 6,162 nodes on the map. Per million uses World Bank population. ATMs are machines mapped in OpenStreetMap.
| # | Country | Nodes | Per million | ATMs |
|---|---|---|---|---|
| 1 | United States | 1,984 | 5.8 | 659 |
| 2 | Germany | 1,031 | 12.35 | 2 |
| 3 | Netherlands | 297 | 16.42 | 39 |
| 4 | Canada | 273 | 6.55 | 452 |
| 5 | France | 244 | 3.55 | 2 |
| 6 | United Kingdom | 236 | 3.4 | 0 |
| 7 | Finland | 199 | 35.24 | 5 |
| 8 | Switzerland | 191 | 21.01 | 62 |
| 9 | Australia | 130 | 4.71 | 16 |
| 10 | Russia | 128 | 0.89 | 2 |
| 11 | Spain | 120 | 2.43 | 109 |
| 12 | South Korea | 92 | 1.78 | 0 |
| 13 | Sweden | 85 | 8.02 | 0 |
| 14 | Czechia | 84 | 7.72 | 81 |
| 15 | Austria | 70 | 7.6 | 2 |
| 16 | Brazil | 70 | 0.33 | 7 |
| 17 | Japan | 68 | 0.55 | 2 |
| 18 | Singapore | 65 | 10.64 | 0 |
| 19 | Italy | 60 | 1.02 | 60 |
| 20 | Poland | 56 | 1.54 | 160 |
| 21 | Ireland | 38 | 6.93 | 0 |
| 22 | Hong Kong | 36 | 4.8 | 2 |
| 23 | China | 34 | 0.02 | 0 |
| 24 | Ukraine | 32 | 0.82 | 10 |
| 25 | Bulgaria | 29 | 4.51 | 22 |
| 26 | Thailand | 29 | 0.4 | 0 |
| 27 | Belgium | 28 | 2.34 | 0 |
| 28 | Romania | 26 | 1.37 | 60 |
| 29 | Lithuania | 25 | 8.65 | 1 |
| 30 | Hungary | 23 | 2.42 | 18 |
| 31 | Norway | 23 | 4.1 | 0 |
| 32 | Mexico | 22 | 0.17 | 34 |
| 33 | Portugal | 22 | 2.04 | 0 |
| 34 | Denmark | 19 | 3.16 | 0 |
| 35 | India | 19 | 0.01 | 0 |
| 36 | New Zealand | 19 | 3.57 | 2 |
| 37 | United Arab Emirates | 17 | 1.48 | 0 |
| 38 | Slovenia | 15 | 7.04 | 3 |
| 39 | Slovakia | 14 | 2.59 | 95 |
| 40 | Argentina | 13 | 0.28 | 4 |
How nodes connect
13,886 of 20,048 reachable nodes (69%) run over Tor, I2P or CJDNS. These networks hide where a node is, so they are counted here but never placed on the map.
About this map
- Reachable nodes, not users. The node count is the number of Bitcoin nodes that accept incoming connections, as seen by the BTC Nodes crawler (btcnodes.io, an independent rebuild of Bitnodes). Many more nodes do not accept connections and are not counted, and one person can run several nodes. It is not the number of Bitcoin users.
- Approximate places. Clearnet nodes are placed by their IP address using the DB-IP Lite database. This usually finds the city or the data centre, and it can be wrong. Nodes are then grouped in hexagonal areas of about 60 km, so no single node is shown.
- Privacy. No node address is published by this site. Areas with fewer than 5 nodes show only the count, without software or network details.
- ATMs are incomplete. The ATM layer shows Bitcoin ATMs that volunteers have added to OpenStreetMap. Many machines are not mapped, so country totals are lower than the real number. You can add a missing ATM on openstreetmap.org.
- Updates. Node data is refreshed every day and ATM data every week, automatically. If a source cannot be reached, the last good data stays on the page with its date, and a notice says so.
Sources: node data BTC Nodes · IP Geolocation by DB-IP (CC BY 4.0) · ATM data © OpenStreetMap contributors, available under the ODbL · population: World Bank (CC BY 4.0) · borders: Natural Earth (public domain). Data files and licences: open data · privacy.